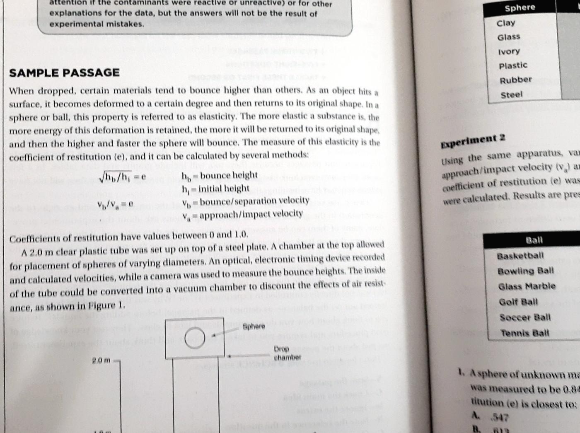
고정 헤더 영역

상세 컨텐츠
본문
728x90
반응형


Score Structure
-
Total score: 400–1600
-
Evidence-Based Reading and Writing Section: 200–800
-
Math Section: 200–800
-
SAT Essay: Three scores ranging from 2–8
Take a closer look at the SAT score structure.
Putting Your SAT Scores in Perspective
Your score report provides a lot of feedback, and it might be hard to know where to start. Mean scores, percentiles, and benchmarks—described below—can help you put your scores in perspective. Subscores and cross-test scores can help you identify strengths and weaknesses and see what skills need more practice. But your score report won’t tell you if you passed because there’s no such thing as a passing score.
Getting into College
If you’re wondering whether your score will help you get into your top-pick colleges, you can use BigFuture's College Search to find out how their freshmen scored. But keep in mind that although SAT scores are important, colleges consider a lot of other factors when they make admission decisions.
Retaking the SAT Takes Practice
As you learn more about scores, keep in mind that many students take the SAT for the first time in the spring of their junior year, and again in the fall of their senior year. Students usually do better the second time. Use your SAT scores to get free practice recommendations and a personalized study plan by linking your College Board and Khan Academy® accounts.
Making Sense of the Numbers
Score ranges, mean (average) scores, benchmarks, and percentiles can be used to see if you’re on track for college readiness.
Important:

Get the Numbers
For percentile tables, means, and scoring details, download SAT Understanding Scores 2019 (.pdf/737 KB).
Score Ranges
Tests can’t measure exactly what you know, and many factors can affect your score. After all, no two days are the same, and if you were to take the SAT three times in a week or once a week for a month, your scores would vary.
That’s why it’s helpful to think of each score as a range that extends from a few points below to a few points above the score earned. Score ranges show how much your score might change with repeated testing, assuming that your skill level remains the same.
Usually, section scores for Evidence-Based Reading and Writing and for Math fall in a range of roughly 30 to 40 points above or below your true ability. Colleges know this, and they receive the score ranges along with your scores to consider that single snapshot in context.
Mean (Average) Scores
Your score report will show you the mean, or average, scores earned by typical U.S. test takers per grade. Unless your score is much lower than average, you’re probably developing the kinds of reading, writing and language, and math skills you’ll need in college.
College and Career Readiness Benchmarks
The SAT College and Career Readiness Benchmarks reflect benchmark scores for both Evidence-Based Reading and Writing and Math sections. Students whose scores meet each section’s benchmarks are considered college and career ready. In other words, if you score at or above the benchmark, you're on track to be ready for college when you graduate high school.
You can also use the detailed feedback in your online score report or speak with your school counselor about your scores to see which skills need the most improvement. Keep in mind that these benchmarks are intended to help you better prepare for life after high school and shouldn’t keep you from pursuing college or enrolling in challenging courses.
Educators: Learn more about benchmarks.
Percentile Ranks
A percentile rank is a number between 1 and 99 that shows how you scored compared to other students. It represents the percentage of students whose scores fall at or below your score. For example, a test-taker in the 57th percentile scored higher than or equal to 57 percent of test-takers.
You'll see two percentiles:
The Nationally Representative Sample percentile compares your score to the scores of typical 11th- and 12th-grade U.S. students.
The User Percentile compares your score to the actual scores of recent graduates who took the new SAT during high school.

728x90
반응형
'SAT Writing' 카테고리의 다른 글
| SAT 과외 수업 국제학교 GPA 관리 (0) | 2020.12.10 |
|---|---|
| SAT 리딩 라이팅 에세이 온라인 과외 (0) | 2020.12.04 |
| SAT ESSAY 에세이 글쓰기 GPA 관리 미국유학 첫걸음 (0) | 2020.05.30 |
| 변화된 미국대학 입시 SAT시험과 History 공부 (0) | 2020.05.25 |
| 미국유학 GPA 관리 World history 공부방법 (0) | 2020.05.21 |


